Top 10 intraday trading strategies
Top 10 Intraday Trading Strategies
- Momentum Trading Strategy.
- Reversal Trading Strategy.
- Swing Trading Strategies
- Gap & Go Trading Strategy.
- Bull Flag Trading Strategy.
- Pull Back Trading Strategy.
- Breakout Trading Strategy.
- Moving Average Crossover Strategy
- Coming Soon in April 2020
- Coming Soon in April 2020
are you beginner or new to Intraday Traders ? No matter Lets Start to understand The Intraday Trading Strategies From basic but before start it just lean about basic of Intraday Trading.
Intraday Trading is one of Short term Trade like 1 minute to 1 hour to 3-4 hour only (some time for just few seconds or minutes only ) for making money from share market
there are many type of trading are there like day trading and intraday trading day trading is like Holding base trading (purchase share today hold it now and may sell it by tomorrow or may Sell after month or may sell after 10-20 years ) it means Holding base trading / day trading
in this case may peoples are believe that in short term they can't earn the money from the share market some peoples are believe that in long term there is nothing any surety to earn money and get healthy profit from the share market so finally all the peoples views are different to trade in share market
 According to above pictures Both are Correct because both views are different different
there are many type of trading are there like day trading and intraday trading day trading is like Holding base trading (purchase share today hold it now and may sell it by tomorrow or may Sell after month or may sell after 10-20 years ) it means Holding base trading / day trading
in this case may peoples are believe that in short term they can't earn the money from the share market some peoples are believe that in long term there is nothing any surety to earn money and get healthy profit from the share market so finally all the peoples views are different to trade in share market

you need to know more about all strategy in deeply before start the trading According to this
intraday trading strategies for Indian market
in short period of trade like intrady trading we hold the trade for long duration in profit and earn more money when we have proper and perfect intraday trading strategies
Intraday Trading Strategies #1
Momentum Trading Strategy.
Day trading is all about movementable. It is about finding the stocks scripts from share market that are moving in share market. There are at least some stocks that move 10-25% in a day or within the two or three days. The key is to find these stocks before they make a big move and catch that move meanwhile you can use Stock scanners can be used to find such stocks scripts for trading.
These stocks with potential momentum move above the Moving Averages or move below the moving average and with no close resistance and have high relative volume. The momentum can be due to a fundamental catalyst like earnings, but the momentum can also be caused without a fundamental back up and is called a technical breakout in share market this technique was using by many intrady traders.

Momentum Trading Strategy mostly works at the beginning of trading hours (at time of share market starting duration ) or at the time of a news came spike which brings huge volume into security / stocks / script and the trade is mostly done at a 2:1 profit loss ratio in all the scripts even in NSE BSE AND MCX Market also.
Thus in momentum trading strategy, the traders focus on stocks with momentum, i.e. the stocks that are significantly moving in one direction and in high volume. The positions can be held for minutes, hours or for the entire day, it was totally depending on speed of the movement of the security script and when it changes the directions its was totally depending on the movement of market we can see at above chart photo after big candlestick it's giving good positive movement in upper side.
this was one of best Intraday Trading strategies so just you can follow it and end enjoy the unlimited profit from share market let us comment was it was help you to improve your trading strategy ?
the stop in reversal trading strategy is always very close as the position is to take close to the closest high or low it means make high profit and and less loss. This will helps to provide a good risk to reward ratio. Reversal intraday trading strategy keeps the bar low and success rate is very high and obvious who do not want that one ?
In reversal intraday trading strategies, the traders look for the stocks that are the extreme highs or lows and thus have a great snap back potential. As soon as the security script begins to reverse, a stop is marked and trailing stops are used to stay in the trade for as long as possible.
A reversal strategy trader waiting for the security scripts to show reversal closes his existing long (buy) position and takes a short (Sell) position to capitalist on the downward price movement, or closes the short position to stop incurring any losses in intraday trading and takes a long (Buy) position to benefits from the upward price movement that was one of the best intraday trading strategy to earn healthy profits from share market please comment us how do you like this reversal trading strategies your valuable feedback was help us to improve quality of post and help to write more about other Intraday trading strategy.

Entry Level - The point where a trade is entered into. This point is generally determined with the help of technical Analysis indicator
Exit Level – in The Share Market Exit Level are Most Important to book profit.
The predefined target where the trade should be squared off after taking a profits.
Stop Loss Level – in The Share market work Without Stop loss is Like to Drive the Bus Without Break. yes it was 100% Correct !!!
The predefined point where the trader need square off position by taking a loss if the market starts to move in an unfavorable direction. This is a must for every trader in order to protect oneself to protect the money (fund) from huge losses.
There are many swing trading strategies are there, some of which are simple and some are complicated which require detailed knowledge of technical Analysis indicators are must be important for intraday trading with swing trading technique.
if you have fundamental analysis knowledge also then it was helpful for you to do best swing intraday trading in share market as well.
One thing that should be common to all the strategies is to follow the stop loss very very very strictly and exit the trade once the predetermined target point has come in order to earn profits on a regular basis and prevent oneself from huge losses.
2. MACD Trend Following Strategy
3. Simple Moving Averages Indicators Strategy
4. Fibonacci retracement strategy
5. Bollinger Bands Indicator Strategy
well we discus later above above 5 topics
Final Conclusion:-
Comment Your Feedback it will help traders to improve the trading strategy.

it was one of best strategy The Gap and Go! is one of those Intraday Trading Strategies that capitalists on the gappers. Gappers are the securities / scripts that show a gap between the prices or between the two candles on a chart when there is an upward or downward movement in the price with no trading in between. Gaps can be created by various factors like earnings announcements, quarterly result, any other type of news releases or a change in the outlook of the scripts analysis.
Mainly Gaps occur at the opening time of the exchanges due to a difference in the market script demand and supply.
These gaps are tapped on by the experience intraday traders to earn healthy profits before the gaps are filled due to the establishment of equilibrium. Gappers are observed in the Morning first hour of trading session and a range is established rising above the range signals a buy and going below the range signals a sell.
The gap and go intraday strategy traders look for gappers and as a thumb rule, take a position in the same direction in the minor trends. For gaps in the direction opposite to the minor trends, positions are taken to the minor trend with a very tight stop-loss with big target range.
The most important characteristic of the gap and go intraday trading strategy is making quick small / big profits with very low risks and gap and go is having one other formula also that will we discus later in some other post meanwhile here before end of this post i suggest you the best intraday trading software and that Trading strategy and benefits also
in That software nothing is required to add multiple of indicators and parameters also nothing required to knowledge about technical analysis and all, Yes Friends Nothing is required to Knowledge about Technical Analysis it was very simple trading software system let see the next Trading Strategy.
A flag Trading Strategies is a pattern formed when there is an explosively strong price move which forms the flagpole, followed by a systematic and diagonally symmetric pullback, which call the flag Trading Strategies. When the resistance line in the flag break, it forms the next leg of the trend move and security Script moves ahead.
The Bull Flag, in particular, (see the chart of Flag in Below and Above Pictures) shows a strong price hike which reaches its peak and then pulls back in an orderly where the highs and lows are almost parallel to each other. Bulls flags are violent in the beginning as the bulls cause a breakout and blindside the bears in that case you get the big profit with small stop loss level.

The Bull Flag Intraday Trading Strategy involves a lot of patience to wait Yes need to Wait for opportunity for the flag to form, and then form the upper and lower trend lines. Then two spots of entry into the trade are marked, one on the flag break and the other on the break of the high. Also, stop-loss points are marked usually under the upper trend line on up trends it was very helpful to day trading and intraday Traders.


Moving average crossover intraday trading strategy is basically a price crossover strategy with Moving Average.
When the price of a security goes above or goes below a moving average, it signals a potential change in trend. and time to trade This strategy eliminates all emotion. It clearly shows the change in momentum when the price of the security crosses over from one side of the moving average to the other.
A crossover below the moving average signals down trend and a crossover above the moving average shows an up trend yes it was very simple to analyze the Moving Average Indicator.

Another type of crossover happens when a short term average crosses a long term average crosses. This signals that a strong move is likely to come. When the short term average crosses and above the long term average, a buy signal is generated and when the short term average crosses below the long term average, a sell signal is generated it was very easy to understand and very easy to trade but main problem is it was very difficult to trade with all the indicators and parameters at the same time analyze at market duration.
Yes ! It was very difficult to analysis all the indicators and Parameters at same time in running market or at the time of open position duration (ruining trade) because in intraday there is no more time to analysis all those thing even many other charting software are available in the market at just amount of Rs. 10,000 to 100,000 but there are required to add indicators and all and after that again required to analyze the all indicators and finally confusing are there then what's the solution ???
Solution is simple Bahubali Intrady Trading Software System are available in market it's cost was nominal as compared to there quality of accuracy of this intraday trading software
In That Software There is No Need to look at chart No need to look at news No Need to add multiple of indicators and parameters No need to any kind of Knowledge of Technical Analysis even software having master performance of some of selected scripts also like in mcx Crude oil, Nickel, Mentha oil, Copper, Natural gas, and in NSE There was having a Big list of scripts you can ask to Bahubali Advisers Company employee to provide the list of script then they will.
In that software having very powerful intraday trading levels like i.e Buy Crude oil 3100 Target 3136 it Means Before end of the day Market defiantly ready to touch 3136 Level and it will practically happen daily basis
Normally in Share market The trading strategy is regularly changing even after this software was given perfect intraday trading levels as regularly because the software company has change there intraday trading software strategy in the software by given new version regularly More details visit bahubaliadvisers.com
These stocks with potential momentum move above the Moving Averages or move below the moving average and with no close resistance and have high relative volume. The momentum can be due to a fundamental catalyst like earnings, but the momentum can also be caused without a fundamental back up and is called a technical breakout in share market this technique was using by many intrady traders.

Momentum Trading Strategy mostly works at the beginning of trading hours (at time of share market starting duration ) or at the time of a news came spike which brings huge volume into security / stocks / script and the trade is mostly done at a 2:1 profit loss ratio in all the scripts even in NSE BSE AND MCX Market also.
Thus in momentum trading strategy, the traders focus on stocks with momentum, i.e. the stocks that are significantly moving in one direction and in high volume. The positions can be held for minutes, hours or for the entire day, it was totally depending on speed of the movement of the security script and when it changes the directions its was totally depending on the movement of market we can see at above chart photo after big candlestick it's giving good positive movement in upper side.
this was one of best Intraday Trading strategies so just you can follow it and end enjoy the unlimited profit from share market let us comment was it was help you to improve your trading strategy ?
Intraday Trading Strategies #2
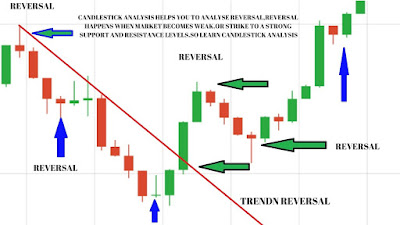
Reversal Trading Strategy.
the Reversal Trading Strategies is one of those Intraday trading strategies that give a chance to enter to buy and sell in the security / script at very close to support price level it means lowest price. As it is always said, buy at low price and sell at high price, this Reversal Trading Strategy helps to take a position as buy or sell on the security / script very close to the support level and gives an opportunity to set the stops it was one of the best intraday trading strategies.
In reversal intraday trading strategies, the traders look for the stocks that are the extreme highs or lows and thus have a great snap back potential. As soon as the security script begins to reverse, a stop is marked and trailing stops are used to stay in the trade for as long as possible.
A reversal strategy trader waiting for the security scripts to show reversal closes his existing long (buy) position and takes a short (Sell) position to capitalist on the downward price movement, or closes the short position to stop incurring any losses in intraday trading and takes a long (Buy) position to benefits from the upward price movement that was one of the best intraday trading strategy to earn healthy profits from share market please comment us how do you like this reversal trading strategies your valuable feedback was help us to improve quality of post and help to write more about other Intraday trading strategy.
Intraday Trading Strategies #3
Swing Trading Strategies

here is the mainly three levels are most important in this strategy.
Exit Level – in The Share Market Exit Level are Most Important to book profit.
The predefined target where the trade should be squared off after taking a profits.
Stop Loss Level – in The Share market work Without Stop loss is Like to Drive the Bus Without Break. yes it was 100% Correct !!!
The predefined point where the trader need square off position by taking a loss if the market starts to move in an unfavorable direction. This is a must for every trader in order to protect oneself to protect the money (fund) from huge losses.
There are many swing trading strategies are there, some of which are simple and some are complicated which require detailed knowledge of technical Analysis indicators are must be important for intraday trading with swing trading technique.
if you have fundamental analysis knowledge also then it was helpful for you to do best swing intraday trading in share market as well.
One thing that should be common to all the strategies is to follow the stop loss very very very strictly and exit the trade once the predetermined target point has come in order to earn profits on a regular basis and prevent oneself from huge losses.
Now time to let us discuss some of the most powerful swing trading strategies:
1. Price Action Strategy2. MACD Trend Following Strategy
3. Simple Moving Averages Indicators Strategy
4. Fibonacci retracement strategy
5. Bollinger Bands Indicator Strategy
well we discus later above above 5 topics
Final Conclusion:-
- The Swing trading is a one of the many ways of making money through the stock market in a short amount or long term amount of time period.
- Although just like any other kind of trading, swing trading strategies require a lot of discipline and practice in order to earn contentiously profits.
- Knowledge of technical Analysis indicators is a must for learning to implement swing trading strategies.
- There are many strategies and some of them are very complex and can be overwhelming. A trader should carefully choose that strategies which suits him / her the most and is simple to understand it was also most important but don't wary about it because before end this session ill give you one better and best suggestion for intraday trading tools and in that tool nothing is required to add multiple of trading indicators and strategies.
Intraday Trading Strategies #4
Gap and Go Trading Strategy

it was one of best strategy The Gap and Go! is one of those Intraday Trading Strategies that capitalists on the gappers. Gappers are the securities / scripts that show a gap between the prices or between the two candles on a chart when there is an upward or downward movement in the price with no trading in between. Gaps can be created by various factors like earnings announcements, quarterly result, any other type of news releases or a change in the outlook of the scripts analysis.
Mainly Gaps occur at the opening time of the exchanges due to a difference in the market script demand and supply.
These gaps are tapped on by the experience intraday traders to earn healthy profits before the gaps are filled due to the establishment of equilibrium. Gappers are observed in the Morning first hour of trading session and a range is established rising above the range signals a buy and going below the range signals a sell.
The gap and go intraday strategy traders look for gappers and as a thumb rule, take a position in the same direction in the minor trends. For gaps in the direction opposite to the minor trends, positions are taken to the minor trend with a very tight stop-loss with big target range.
The most important characteristic of the gap and go intraday trading strategy is making quick small / big profits with very low risks and gap and go is having one other formula also that will we discus later in some other post meanwhile here before end of this post i suggest you the best intraday trading software and that Trading strategy and benefits also
in That software nothing is required to add multiple of indicators and parameters also nothing required to knowledge about technical analysis and all, Yes Friends Nothing is required to Knowledge about Technical Analysis it was very simple trading software system let see the next Trading Strategy.
Intraday Trading Strategies #5
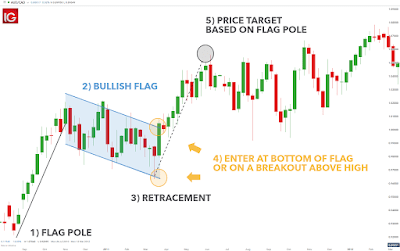
Bull Flag Trading Strategy

The Bull Flag, in particular, (see the chart of Flag in Below and Above Pictures) shows a strong price hike which reaches its peak and then pulls back in an orderly where the highs and lows are almost parallel to each other. Bulls flags are violent in the beginning as the bulls cause a breakout and blindside the bears in that case you get the big profit with small stop loss level.

The Bull Flag Intraday Trading Strategy involves a lot of patience to wait Yes need to Wait for opportunity for the flag to form, and then form the upper and lower trend lines. Then two spots of entry into the trade are marked, one on the flag break and the other on the break of the high. Also, stop-loss points are marked usually under the upper trend line on up trends it was very helpful to day trading and intraday Traders.
Intraday Trading Strategies #6
Pull Back Trading Strategy
The pullback is a term used to describe a short-term move in the security / Script in the opposite direction of a long term trend. It gives a chance to join the trend without following the security Script.
In the world of intraday trading, it is often said that "Trend is your friend", it means need to following trend and get benefited profit which is quite true however, the pullback intraday trading strategy helps to protect the trader from drowning when he is swimming with the trend. Firstly, it has to be clearly understood that the pullback is actually a pullback and not a trend reversal.

This can be done by observing the volumes and taking a look at the last trading day
In a pullback intraday trading strategy, weaknesses are bought and strengths are sold. Securities Script that are up trending will pull back giving a low-risk buying opportunity, and securities Scripts that are down trending will go up offering a low-risk selling opportunity.
Pullbacks are mostly bought in the Traders Action Zone. Another great opportunity to enter into buying a pullback is right after a breakout
Intraday Trading Strategies #7
Breakout Trading Strategy
Break out trading means entering the Stock market when the price moves outside a particular price range, its own support and resistance. It is accompanied by an increase in volume. Traders make use of the technical analysis indicator Volume Weighted Moving Average (EMA) to understand and catch breakouts
The keyword for Breakout Trading Strategy is quickness. It needs very quick and aggressive entries and exits in stock market. It is one of those instant intraday trading strategies which does not involve waiting, traders know it right then if the trade is going to work or not

more details look at above given chart and Traders are following the Breakout Trading Strategy for Intraday identify a price level which can be their breakout trading level, wait for a breakout and identify the resistance level and then wait for the break out to close (the closing is must be important of rall scripts and for all the charts like daily monthlly weekly or intraday chart) above the resistance level. However, breakout trading is quite risky as the traders are buying the security Script that everyone else is, and there is hardly anyone left to buy it after the traders get in.
Intraday Trading Strategies #8
Moving Average Crossover Strategy
When the price of a security goes above or goes below a moving average, it signals a potential change in trend. and time to trade This strategy eliminates all emotion. It clearly shows the change in momentum when the price of the security crosses over from one side of the moving average to the other.
A crossover below the moving average signals down trend and a crossover above the moving average shows an up trend yes it was very simple to analyze the Moving Average Indicator.

Another type of crossover happens when a short term average crosses a long term average crosses. This signals that a strong move is likely to come. When the short term average crosses and above the long term average, a buy signal is generated and when the short term average crosses below the long term average, a sell signal is generated it was very easy to understand and very easy to trade but main problem is it was very difficult to trade with all the indicators and parameters at the same time analyze at market duration.
Yes ! It was very difficult to analysis all the indicators and Parameters at same time in running market or at the time of open position duration (ruining trade) because in intraday there is no more time to analysis all those thing even many other charting software are available in the market at just amount of Rs. 10,000 to 100,000 but there are required to add indicators and all and after that again required to analyze the all indicators and finally confusing are there then what's the solution ???
Solution is simple Bahubali Intrady Trading Software System are available in market it's cost was nominal as compared to there quality of accuracy of this intraday trading software
In That Software There is No Need to look at chart No need to look at news No Need to add multiple of indicators and parameters No need to any kind of Knowledge of Technical Analysis even software having master performance of some of selected scripts also like in mcx Crude oil, Nickel, Mentha oil, Copper, Natural gas, and in NSE There was having a Big list of scripts you can ask to Bahubali Advisers Company employee to provide the list of script then they will.
In that software having very powerful intraday trading levels like i.e Buy Crude oil 3100 Target 3136 it Means Before end of the day Market defiantly ready to touch 3136 Level and it will practically happen daily basis
Normally in Share market The trading strategy is regularly changing even after this software was given perfect intraday trading levels as regularly because the software company has change there intraday trading software strategy in the software by given new version regularly More details visit bahubaliadvisers.com
overall Intraday Trading Strategies Conclusion:-
- Thus, conclusively, multiple strategies are available to be used by the intraday traders, but the use of the correct strategy at the correct time is the key.
- There are only 4.5% of the intraday traders who end up successful and those are the ones who not only understand and implement the intraday trading strategies but do it at the right time, with sheer dedication and resilience.
- The strategies are to be tried and tested and then implemented to make profits. Along with the use of strategies, the trading disciple and the emotional instinct of the intraday trader play a very crucial role in success.
- Best Intraday Trading software is Available i the market so we can use it to get good support for healthy profit and easy to trade in share market for Best intraday trading software is also providing by Bahubaliadvisers.com Company


